The Star Tribune and Minnesota Public Radio News polled 800 Minnesota likely voters between Oct. 15 and Oct. 17. Highlights from questions about the Minnesota attorney general's race are below. In addition to the DFL and GOP candidates in the race, Noah Johnson is running as the Grassroots-Legalize Cannabis candidate. Scroll down the page to see details about how the poll was conducted and the demographics of the 800 respondents.
If the 2018 general election for Minnesota attorney general were held today, would you vote for...?
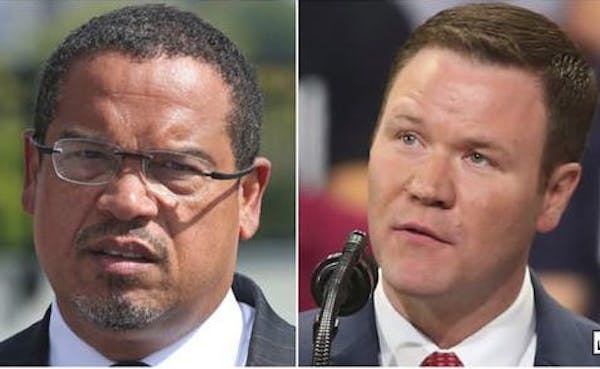
Keith Ellison
(DFL) Doug Wardlow
(Republican) Other Undecided 36% 43% 5% 16% Ellison Wardlow Other Undecided Men 33% 49% 5% 13% Women 39 38 5 18 Democrats 76 3 1 20 Republicans 3 86 2 9 Independents / other 21 47 14 18 18-34 48 37 3 12 35-49 33 43 6 18 50-64 36 45 7 12 65+ 31 46 4 19 Under $50,000 42 35 5 18 $50,000 and over 33 48 5 14 Hennepin / Ramsey 50 29 4 17 Metro Suburbs 27 51 5 17 Southern Minn. 36 49 3 12 Northern Minn. 30 48 9 13 Keith Ellison
(DFL) Doug Wardlow
(Republican) Other Undecided 41% 36% 5% 18% Ellison Wardlow Other Undecided Men 36% 43% 6% 15% Women 46 30 3 21 Democrats 85 0 4 11 Republicans 2 80 2 16 Independents / other 27 36 8 29 18-34 62 16 5 17 35-49 36 37 5 22 50-64 35 40 5 20 65+ 38 45 3 14 Under $50,000 37 38 5 20 $50,000 and over 40 38 4 18 Hennepin / Ramsey 52 29 4 15 Metro Suburbs 35 40 5 20 Southern Minn. 36 36 5 23 Northern Minn. 36 44 5 15 Do you recognize the name ______? (IF YES) Do you have a favorable, unfavorable or neutral opinion of ______?
Keith Ellison Doug Wardlow Recognize Favorable 23% 13% Recognize Unfavorable 35 8 Recognize Neutral 24 23 Don't Recognize 18 56 Keith Ellison Doug Wardlow Recognize Favorable 20% 8% Recognize Unfavorable 31 5 Recognize Neutral 29 18 Don't Recognize 20 69 The ex-girlfriend of Keith Ellison, the Democratic nominee for attorney general, has alleged that he committed an act of domestic violence against her. Do you believe her allegation, or not?
Yes, believe No, don't Not sure 30% 21% 49% Yes, believe No, don't Not sure Men 36% 20% 44% Women 25 22 53 Democrats 13 31 56 Republicans 48 14 38 Independents / other 33 16 51 18-34 28 21 51 35-49 27 21 52 50-64 33 18 49 65+ 32 25 43 Under $50,000 28 25 47 $50,000 and over 33 19 48 Hennepin / Ramsey 24 25 51 Metro Suburbs 36 20 44 Southern Minn. 29 22 49 Northern Minn. 33 14 53 Yes, believe No, don't Not sure 21% 22% 57% Yes, believe No, don't Not sure Men 25% 19% 56% Women 18 24 58 Democrats 5 30 65 Republicans 42 15 43 Independents / other 20 19 61 18-34 15 24 61 35-49 20 19 61 50-64 21 21 58 65+ 27 24 49 Under $50,000 19 23 58 $50,000 and over 22 22 56 Hennepin / Ramsey 16 27 57 Metro Suburbs 24 19 57 Southern Minn. 16 24 60 Northern Minn. 32 14 54 About the poll
This Star Tribune/MPR News Minnesota Poll findings are based on interviews conducted Oct. 15-17 with 800 Minnesota likely voters. The interviews were conducted via land line (60 percent) and cellphone (40 percent). The poll was conducted for the Star Tribune and Minnesota Public Radio News by Mason-Dixon Polling and Research Inc. Results of a poll based on 800 interviews will vary by no more than 3.5 percentage points, plus or minus, from the overall population 95 times out of 100. Margins are larger for groups within the sample, such as Democrats and Republicans, and age groups. The self-identified party affiliation of the respondents is 38 percent Democrats, 33 percent Republicans and 29 percent independents or other. Sampling error does not take into account other sources of variation inherent in public opinion surveys, such as nonresponse, question wording or context effects. In addition, news events may have affected opinions during the period the poll was taken. Readers can e-mail questions to matt.delong@startribune.com. Demographic breakdown of this polling sample
PARTY DFL/Democrat 306 (38%) Republican 265 (33%) Independent/Other 229 (29%) AGE 18-34 136 (17%) 35-49 210 (26%) 50-64 237 (30%) 65+ 210 (26%) Refused 7 (1%) GENDER Male 384 (48%) Female 416 (52%) INCOME < $25,000 106 (13%) $25,000-$49,999 119 (15%) $50,000-$74,999 131 (16%) $75,000-$99,999 129 (16%) $100,000+ 140 (18%) Refused 175 (22%) REGION Hennepin/Ramsey 255 (32%) Metro Suburbs 230 (29%) Southern Minnesota 160 (20%) Northern Minnesota 155 (19%) INTERVIEW Land-line 479 (60%) Cell Phone 321 (40%)